Juvenile Rehabilitation

  • Room Confinement and Isolation

    Clients in JR can be placed in room confinement (locked in the room designated for their sleeping, during times when other clients are outside of their rooms) or in isolation (locked in a room that is not designated for their sleeping, often a padded room). DCYF tracks the 30 day rate of room confinement and isolation for clients released from residential facilities each state fiscal year (SFY). In SFY 2023, the 30 day RCI rate for Hispanic clients was 2.97, meaning that Hispanic clients who released in SFY 2023 experienced, on average, 2.97 RCI events every 30 days, during their stay with JR.

    Thirty Day Rate of Room Confinement/Isolation by Race/Ethnicity, SFY 2017-2023
      depressed adults
     
  • Community Facility Placement

    All clients in JR start at an institution. After they have spent 10% or 30 days of their sentence in an institution, most clients can be considered for placement in a community facility. DCYF tracks the disparity ratio of community facility placement. A ratio of 1.0 indicates that clients of that race/ethnicity are placed in community facilities at the same rate that they are placed in JR. A ratio above 1 indicates that group is placed at a higher frequency, and a ratio below 1 indicates that they are placed at a lower rate than their overall population in JR.

    Racial/Ethnic Disparity Ratios for Community Facility Placement, 2017-2023
      depressed adults
     
  • Discretionary Parole Placement

    Approximately 50% of clients in JR are assigned to parole aftercare. Although about half of parole assignments are mandatory based on a client’s committing offense, the remaining half of parole assignment is based on JR discretion. DCYF tracks racial/ethnic disparity in discretionary parole placement using a Disparity Ratio. A value of 1.0 indicates that clients of that race/ethnicity are placed on parole at the same rate that they are placed in JR. A ratio above 1 indicates that group is placed at a higher frequency, and a ratio below 1 indicates that they are placed at a lower rate than their overall population in JR.

    Racial/Ethnic Disparity Ratios for Discretionary Parole Placement, SFY 2017-2023
      depressed adults
     
  • Employment after Juvenile Rehabilitation

    Employment for youth and young adults leaving residential facilities in Juvenile Rehabilitation is another outcome indicator for creating successful transitions to adulthood for youth and young adults in our care. Among young adults released in State Fiscal Year 2021, 68% found some work in the following year. Across the years, employment rates varied significantly by race and ethnicity. Asian clients had the highest rates of employment, while American Indian/Alaska Native clients had the lowest.

    Quarters Worked First Year After Release from Juvenile Rehabilitation by Young Adults 18+ at Release, SFY 2014-2021
      graph

  • Juvenile Rehabilitation and Mental Health

    Another outcome indicator for the strategic priority to improve the quality and availability of provider services is mental health need and parole aftercare availability for youth and young adults released from Juvenile Rehabilitation facilities. Post-release aftercare services increase the likelihood that youth and young adults will reenter their communities and live socially responsible and stable lifestyles. About half of youth and young adults with identified mental health needs are released with no parole aftercare services. DCYF continues to strive to find creative ways to service the unfunded post-release needs of this group. Each year, among the youth and young adults who are released to Intensive Parole services, more than half have identified mental health needs.

    Youth and Young Adults Released from Juvenile Rehabilitation, by Identified Mental Health Need and Parole Aftercare, SFY 2016-2023
      graph
     
  • Equity in Dialectical Behavior Therapy in JR

    Dialectical Behavior Therapy (DBT) is the primary residential treatment for youth and young adults in Washington’s Juvenile Rehabilitation (JR) facilities. Two integral components of DBT are individual counseling sessions and skills groups. JR’s standard is for residents to attend 4 of each per month. Equitable access to appropriate treatment is a driver of equitable outcomes. Residents who are Black/African American or Asian/Pacific Islander received less DBT treatment than did other groups.

    Average Number of Dialectical Behavior Therapy (DBT) Individual Sessions Attended per Month by Juvenile Rehabilitation Facilities Residents, by Race/Ethnicity, SFYs 2021-2023
      graph
    Average Number of Dialectical Behavior Therapy (DBT) Skills Groups Attended per Month by Juvenile Rehabilitation Facilities Residents, by Race/Ethnicity, SFYs 2021-2023
      graph
     
  • Youth Detention Rates

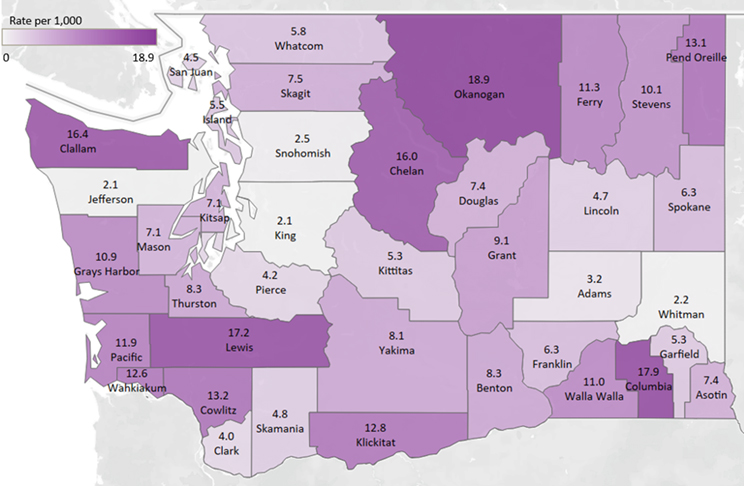
    Another systems-related measure to track in this area is youth detention rates. As parents and caregivers are more supported to meet the needs of their youth, more youth and adolescents will be able to avoid juvenile detention. Across Washington, the average youth detention rate in 2020 was 5.4 admissions per 1,000 youth ages 12-17.

    Youth Detention Rates per 1,000 Youth Age 12-17, by County, 2020
      graph