Youth Suicide Rates
Youth Suicide Rates
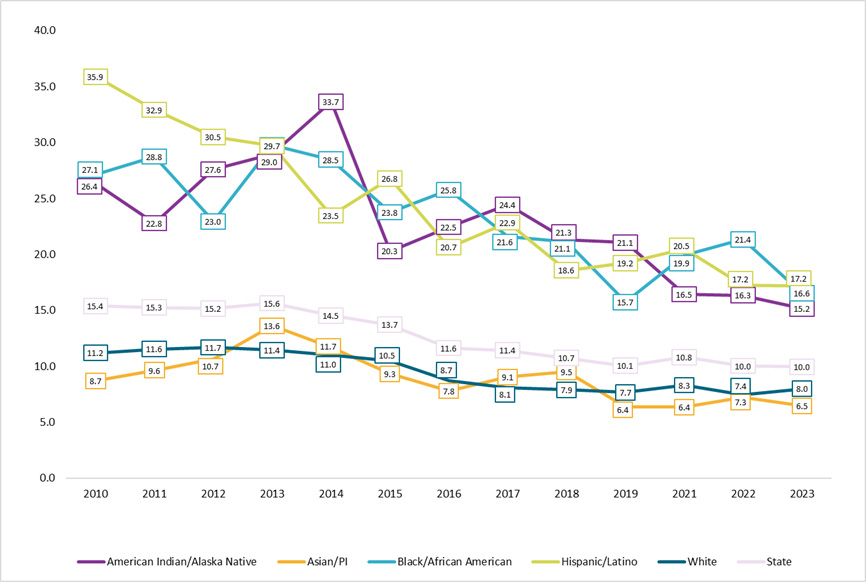
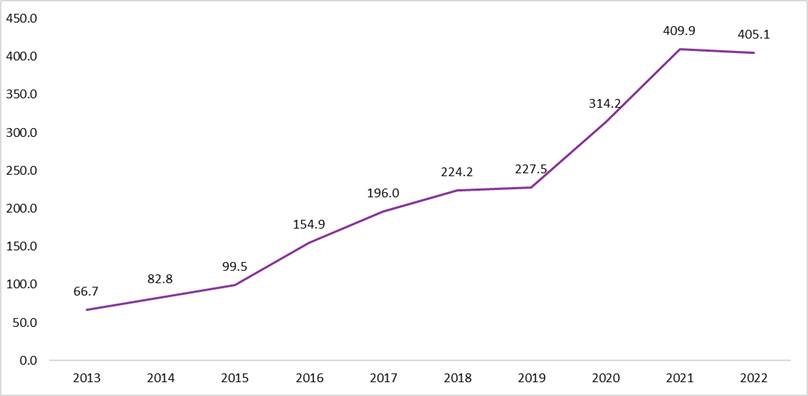
One of DCYF’s health goals is for youth to experience positive behavioral and mental health. Trends in mental health over the past decade show an increase in rates of suicide and attempted suicide. Between 2013 and 2021, rates of youth suicide and attempted suicide have increased by more than 600%.
Rate of Suicide and Suicide Attempts per 100,000 Adolescents Age 10-17, 2013-2022
Rate of Suicide and Suicide Attempts per 100,000 Adolescents Age 10-17, 2013-2022
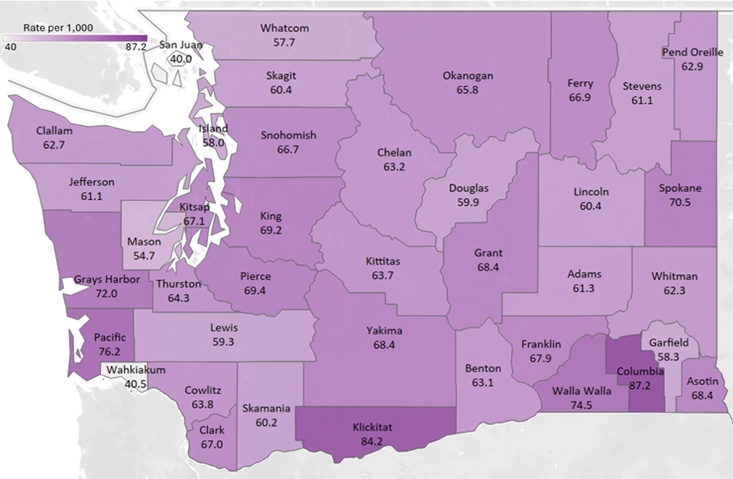
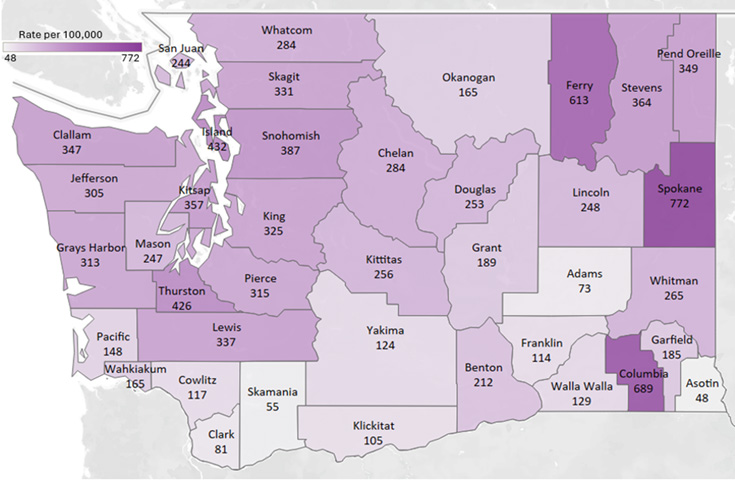
Suicide and Suicide Attempts per 100,000 Adolescents Age 10-17, 5 Year Rate, 2018-2022
Suicide and Suicide Attempts per 100,000 Adolescents Age 10-17, 5 Year Rate, 2018-2022