Child Welfare

  • Disproportionality in Child Welfare

    Child welfare disproportionality is another outcome indicator for our strategic priority to eliminate racial disproportionality and advance racial equity. DCYF tracks disproportionality in Child Welfare across multiple decision points, using Disproportionality Ratios. Scores of 0 – 0.99 indicate that, compared to its proportion in the population, a group is underrepresented at that decision point, while scores of 1.1 and greater indicate that a group is overrepresented. Black/African American, American Indian/Alaska Native, and White children and youth are overrepresented compared to their representation in the underlying population.

    Much of these disproportionalities in placement are attributable to disproportionalities at intake.

    Racial/Ethnic Disproportionality Ratios for All Child Welfare Intakes (Screened Out or Screened-In), 2014-2022
      graph
    Racial/Ethnic Disproportionality Ratios for Screened-In Child Welfare Intakes, 2014-2022
      graph
    Racial/Ethnic Disproportionality Ratios for Child Welfare Removals, 2014-2021
      graph
     
  • CPS Response Rates

    One of DCYF's resilience goals is that parents and caregivers are supported to meet the needs of children and youth. From a prevention standpoint, if parents are supported in meeting the needs of their children and youth, they will experience improved outcomes in safety and well-being. As an indicator for this outcome, DCYF is monitoring the rate at which children require a response from CPS.

    Children and Youth (Age 0-17) Requiring a CPS Response, per 1,000, 2010-2022
      graph
     
  • Permanency

    DCYF works to achieve permanency for children as quickly and safely as possible. The goal is to reunify children with their families when parents demonstrate that they are able to safely care for their children. When children cannot be safely reunified, DCYF makes efforts to achieve permanency through adoption and guardianship as quickly as possible. Of children who were removed from their parents in state fiscal year 2022, over 40 percent were able to achieve permanency within 12 months of their placement out of their parent’s home; the federal target is 37.9 percent or more. Over 96 percent of the children achieving permanency within 12 months were reunified with their families.

    Children Placed in Safe and Permanent Homes Within 12 Months of Entering Care, SFY 2010-2022
      graph
     
  • Placement Stability

    It is important that children who are removed from their homes experience stability while they are in out-of-home care. To monitor the stability of children in out-of-home placement, DCYF monitors the number of placement moves per 1,000 days in out-of-home care for children and youth entering care during a 12-month cohort period (federal measure) and during the first 90 days (state measure). The federal target is 3.98 moves or fewer; in state fiscal year 2023, Washington had an overall rate of 5.20 on this measure, 1.22 percentage points higher than the federal target. Disaggregation by placement setting however, shows that the kinship care stability rate meets the federal target, while rate for non-kin foster care does not. The state measure of stability is typically greater than the federal measure because a high proportion of the moves that children and youth experience occur in the first 90 days.

    Rate of Placement Moves per 1,000 Days in Care, Federal and State Stability Measures, SFY 2010-2023
      graph
    Federal Stability Measure: Rate of Placement Moves per 1,000 Days in Care, by Placement Setting, SFY 2010-2023
      graph
     
  • Employment After Foster Care

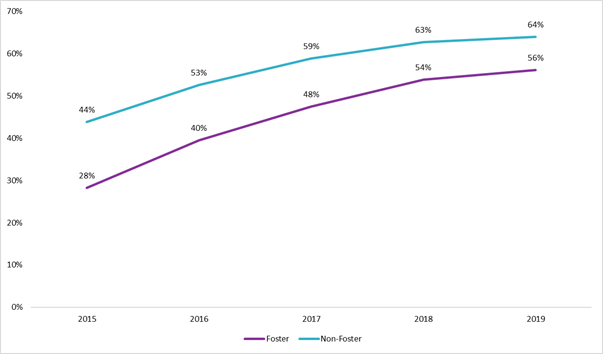
    Between 2015 and 2019, the gap between employment rates for young adults who have experienced foster care and those who have not, decreased in Washington State. During the same time period however, the gap in median earnings between the two groups widened, and that increase cannot be attributed to differences in number of hours worked. Longitudinal analysis shows that over time, the employment rate for young adults who have experienced foster care approaches the employment rate for young adults who have not, but that the gap in median earnings continues to increase.

    Employment Among Young Adults, Age 18+, by Former Foster Status, 2015-2019
      graph
     
  • Kinship Care Licensure

    The term "kinship care" refers to the full-time care of a child by relatives or suitable others (unrelated kin). In State Fiscal Year (SFY) 2023, over 50% of children experiencing out-of-home care were placed with kin. DCYF strongly encourages kinship caregivers to be licensed and can provide additional support to licensed caregivers, including foster care reimbursement. Over the past few years, the percentage of licensed kinship caregivers has more than doubled.

    Number and Percent Kinship Care Providers Licensed, Last Day of State Fiscal Year, 2013-2023
      graph
     
  • Intake Decisions

    An intake is the process by which DCYF receives and processes reports of child abuse or neglect. In State Fiscal Year 2023, 54% of children referred for intake had cases that were screened-in for further investigation. Since 2010, Washington State’s population has grown by 18% (Office of Financial Management), and the number of annual intakes has accordingly increased. The percentage of children whose intake cases were screened-in however, has remained fairly consistent since 2015.

    Intakes by Screening Decision and State Fiscal Year, 2010-2023
      graph
     
  • Disparity in Child Welfare

    Where disproportionality identifies the over or under representation of a group compared to that group in the underlying population, disparity identifies inequity after a child or youth has entered the system by comparing the proportion of a group at a decision point to the proportion of that group at a prior decision point. DCYF tracks disparity in Child Welfare using Disparity Ratios; a disparity ratio of 1.0 would represent no change between decision points, whereas ratios greater than 1.0 indicate that the group proportion has increased since the prior decision point. An increase means that other racial/ethnic groups have exited the system to a greater extent by this point and is a sign of disparity.

    Racial/Ethnic Disparity Ratios for Out-of-Home Care Placements within 12 Months of Intake, 2014-2021
      graph
    Racial/Ethnic Disparity Ratios for Out-of-Home Care Lasting Longer than Two Years, 2014-2019
      graph
     
  • High School Graduation of Youth in Foster Care

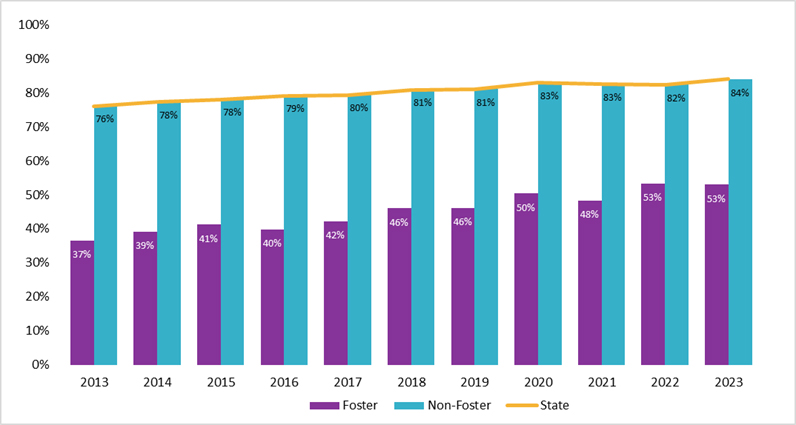
    One of DCYF’s strategic priorities is that we create successful transitions to adulthood for youth and young adults in our care. Graduation from high school is an outcome indicator for this priority. Statewide, the 2022 four year graduating cohort included 85,240 students, 82% of whom graduated on time. In most years, an additional 2-3 percent of the class have graduated by the end of their fifth year. Among that 2022 cohort, 623 youth were indicated as having been in foster care. Youth who have not been in foster care graduated at the rate of the overall class, whereas 53% of youth who had been in foster care graduated on time. In recent years, an additional 2-10% of those youth did graduate from high school after their fifth year.

    Four Year Graduation Rate, by Foster Care Status, Classes of 2013-2022
      graph
    Five Year Graduation Rate, by Foster Care Status, Classes of 2013-2022
      graph

  • Housing Instability

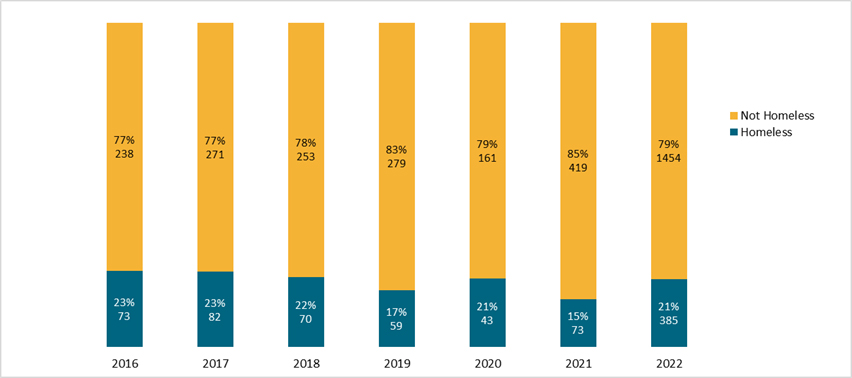
    Housing instability is a balancing indicator for our outcomes related to creating successful transitions to adulthood. Youth and young adults who exit the foster care system without being placed into a permanent family through reunification, adoption, or guardianship are often referred to as "aging out" of foster care. These youth are at higher risk of becoming homeless or unstably housed than those who have a family to support them at this critical life transition. Across the past five years, within 12 months of leaving care, about 20% of former foster youth experienced an episode of housing instability or homelessness.

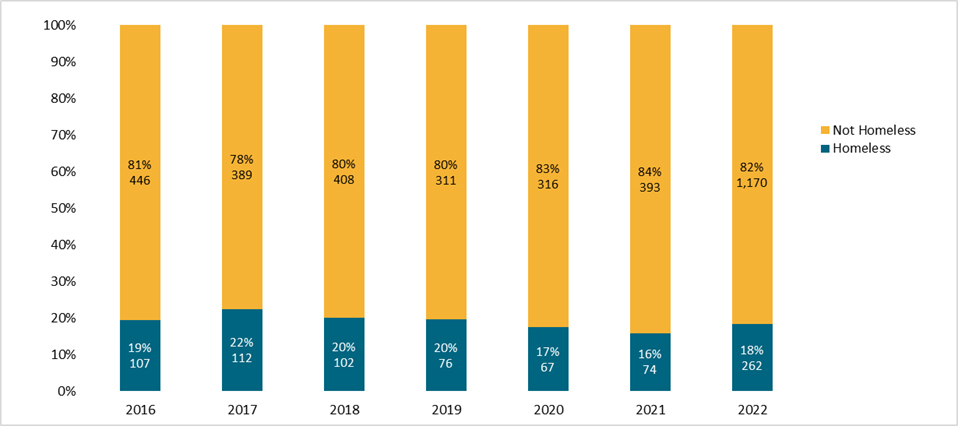
    Analysis has also been done about the housing instability of youth and young adults (ages 12 to 25) who are released from a Juvenile Rehabilitation institution. From 2018-2021, the rates of homelessness for youth and young adults leaving Juvenile Rehabilitation institutions has mirrored those of former foster youth. Across the past five years, 20 percent experienced an episode of housing instability or homelessness within 12 months of discharge.

    Homelessness Among Former Foster Youth within 12 Months of Leaving Foster Care, State Fiscal Years 2016-2021
      graph
    Homelessness Among Youth and Young Adults within 12 Months of Leaving Juvenile Rehabilitation, 2016-2021
      graph